As more businesses shift away from running workloads on dedicated virtual machines to running them inside containers using workload orchestrators like Kubernetes, adversaries have become more interested in them as targets. Moreover, the benefits Kubernetes provides for managing workloads are also extended to adversaries. As adversaries leverage Kubernetes to run their workloads, their understanding of how these platforms work and can be exploited increases.
With this in mind, the goal of this post is to help you understand the components that make up your cluster, how to gain visibility into it, share some of our container-based threat hunting strategies, and how to secure your cluster against attack in the first place.
Contents
- Why is AKS a good target for adversaries
- Understanding your AKS cluster architecture
- Visibility into activity on your cluster
- Hunting hypotheses and queries
- Securing your cluster
Why would AKS be a good target for an attacker?
There are a few reasons why an attacker might be interested in targeting workloads running on AKS.
To begin with, Kubernetes is a distributed system that allows us to abstract away the complexities of running complex workloads. This means that the applications running on Kubernetes clusters tend to be distributed applications themselves with connections to storage accounts, key vaults and other cloud resources. The secrets needed to access these resources are available to the cluster and can allow an attacker to pivot to other resources in your Microsoft subscription.
Secondly, AKS is a ready-made “give us your code and we will run it” API. This is exactly what most threat actors are looking for after they gain initial access to a target as it removes the need for them to find a means of executing their malware payload. They can simply containerize their code and tell the Kubernetes API server to run it alongside the existing containerized workloads.
Finally, containerized workload orchestrators are becoming more prevalent as an attack target with the increasing number of companies relying on them for their mainstream workloads. The expanding relevance of container-based platforms is reflected by the increasing number of available cloud and third-party services, like Azure Service Fabric, that now offer to host code as containers, in addition to traditional means.
Understanding your AKS cluster architecture
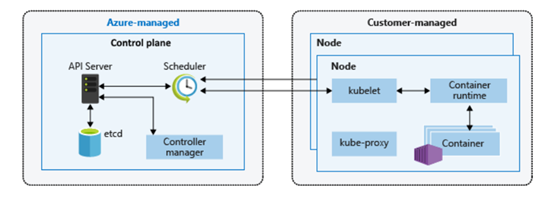
The goal of this section is to de-mystify the Azure and Kubernetes objects that are deployed by default when you create a Kubernetes cluster so you can better protect them. This section assumes you are familiar with basic Kubernetes architecture and components.
When threat hunting across any Kubernetes cluster, there are three high value assets to be aware of:
Kubernetes API server
This is the centralized API that handles all requests made by the cluster’s worker nodes and resides in the cluster’s control plane. This is a key juncture defenders can monitor as it provides a single portal into the cluster activity. An adversary with access to an authorized user or service account token can talk with the Kubernetes API server to read sensitive information about the cluster such as information on the cluster configuration, workloads and secrets as well as the ability to make changes to the cluster.
Etcd
This component is also found in the control plane and is a key-value store that contains all the state configuration for the cluster. It is the ultimate source of truth on the state of the cluster and contains valuable data like cloud metadata, and credentials. If an adversary has write access to etcd, they can modify the state of the cluster whilst bypassing the Kubernetes API server. With read access, an adversary has access to all the secrets and configuration for the cluster. You can think of this as having cluster admin read permissions to the Kubernetes API server.
kubelet
Every worker node has a kubelet which communicates with the container runtime to manage the lifecycle of pods and containers on the node. It continuously polls the Kubernetes API server to make sure the current state of these pods matches the desired state. If it needs to update or create a new pod, it will instruct the container runtime to configure the pod namespace and then start the container process. Given the open-source nature of the kubelet and the containerd container runtime, they are vulnerable to supply chain attacks by a well-resourced attacker. To achieve this, an attacker would need to successfully release an update to the kubelet or containerd and have that update applied to existing Kubernetes clusters. Such backdoor access to the kubelet and containerd would provide an attacker the same level of access as having access to the cluster’s worker node
When you deploy an AKS cluster, the control plane for your cluster is managed by Azure which means that you don’t have access to the components within the control plane. However, this does not exempt the Kubernetes control plane logs being critically important for our threat hunting, as we will see later in the blog post
The AKS Resource Provider (RP) and Resource Groups
When you deploy an AKS cluster, you create two Resource Groups:
-
The first is the Resource Group you selected or created when you deployed your AKS cluster, it contains the
Microsoft.ContainerService/managedClusterresource which represents your logical cluster within Azure. -
The second Resource Group contains all the infrastructure that is needed to run your workloads and has the
MC__naming scheme. This includes the Kubernetes worker nodes, virtual networking, storage, and Managed Service Identities (MSIs). This resource group is also commonly referred to as the “Managed Resource Group” in reference to the fact that the contents of this resource group are managed by the AKS Resource Provider.
In simple terms, the AKS Resource Provider is the Azure control plane REST API that allows customers to create, upgrade, scale, configure, and delete clusters, as well as easily fetch credentials for kubectl. Behind the scenes, it is also responsible for cluster upgrades, repairing unhealthy clusters, and maintaining your Azure-managed control plane services.
Agent Node Pool
This is the Virtual Machine Scale Set (VMSS), or Kubernetes nodes that are deployed to run your containerized workload. Multiple VMSSs may be present if you have multiple node pools in your cluster, and you might also see Azure Container Instances if you are using Virtual Nodes.
Namespaces
Namespaces are how Kubernetes logically isolates the different workloads within your cluster. When you create an AKS cluster, the following namespaces are created for you:
default- This is where Kubernetes objects are created by default and the namespace queried by kubectl when no namespace is provided.kube-node-lease- Contains node lease objects which are used by Kubernetes to keep track of the state of cluster nodes.kube-public- This namespace is readable by all cluster users, including unauthenticated users, and is unused by AKS.kube-system- Contains objects created by Kubernetes and AKS itself to provide core cluster functionality.
Deployments
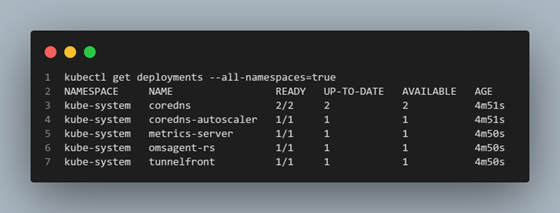
A Kubernetes Deployment is a group of one or more identical Pods and ReplicaSets. By default, the following Deployments are created with your AKS cluster:
corednsandcoredns-autoscaler– Provides DNS resolution and service discovery for cluster workloads, allowing you to access http://myservice.mynamespace.cluster.local within your cluster.metrics-server- The Metrics Server which is used to provide resource utilization to Kubernetes,omsagent-rs- This is the monitoring agent for AKS used to provide Container Insights. It’s an opt-in feature and wont’ be present unless you have enabled Container Insights.tunnelfront– Provides a reverse SSH tunnel connection between the Azure managed control plane Virtual Network and the customer managed data plane that hosts your AKS workload. This tunnel connection is needed to allow the Kubernetes control plane to perform certain actions on the cluster’s data plane such as port forwarding and log collection. This is on the path to deprecation and will be replaced by konnectivity-agent.konnectivity-agent– This will replacetunnelfrontas the mechanism the Kubernetes API server uses to access the cluster’s worker nodes. This pod contains the agent the Konnectivity server communicates with to send requests to the kubelet and execute commands. You can learn more about the Konnectivity implementation here.
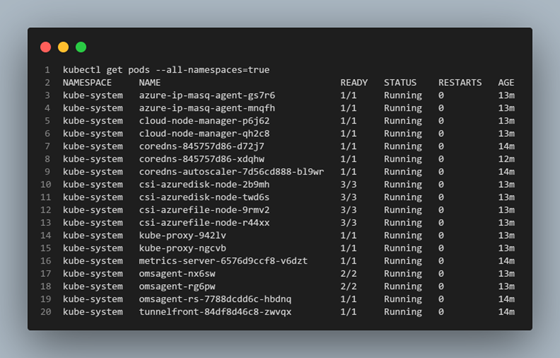
The pods associated with these deployments, and other DaemonSets can be seen below and are deployed to the kube-system namespace.
Visibility into your cluster
When you deploy your AKS cluster, you have the option of creating a Log Analytics Workspace. If deployed, this is where Azure will send the log associated with your cluster. Log Analytics Workspaces also provide an interface for you to query these logs using the Kusto Query Language (KQL).d with your cluster. Log Analytics Workspaces also provide an interface for you to query these logs using the Kusto Query Language (KQL).
Default Log Availability
By default, Azure does not enable control plane logs for your cluster but makes it easy for you to configure the level of control plane visibility you need. This is due to the sheer volume of logs that can be generated by the AKS control plane. The control plane logs include requests made to the Kubernetes API server and without them, it can be immensely difficult to monitor significant configuration changes and risky metadata requests being made to your cluster. To configure control plane logging for your cluster, follow these steps:
-
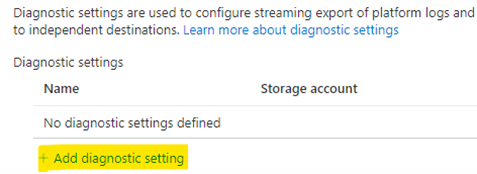
Head to your AKS cluster in the Azure Portal and find the Diagnostic settings entry in the left sidebar.

-
Choose + Add diagnostic setting
-
Select the log categories you are interested in recording (see below for more information on these logs), and then select Send to Log Analytics workspace under Destination details, selecting the workspace you created earlier. Give it a descriptive name and click Save.
kube-apiserverlogs record the operational activity of the Kubernetes API server. These do not include the requests to the Kubernetes API server itself so are most useful for troubleshooting cluster operation rather than as security log. For security investigations, thekube-auditlogs are the most useful.kube-auditlogs provide a time-ordered sequence of all the actions taken in the cluster and are brilliant for security auditing. It is a superset of the information contained in thekube-apiserverlogs and includes operations which are triggered inside the Kubernetes control plane. This includes all requests made to the Kubernetes API server for deploying resources and command execution (create events), retrieving resources (list and get events), updating resources (post and patch events), and deleting resources (delete events).kube-audit-adminlogs are a subset of thekube-auditlogs and reduce the volume of logs collected by excluding all get and list audit events. This means that enumeration and reconnaissance activity through get and list events will not be recorded, but requests that modify the state of your cluster will be recorded (patch, post, create and delete events).guardlogs provide Azure Active Directory (AAD) authorization logs if your cluster is integrated with AAD or configured to use Kubernetes RBAC (role-based access control).
You can find more information about the different log types available on AKS here and the location of the log files on the cluster itself here.
Linux Host-Level Audit Logging
Unlike the log sources above, enabling auditd logging on your cluster gives you visibility into your AKS worker node and container kernel level activity, such as program executions and command line activity. It is highly configurable and especially valuable if you are running a multi-tenant cluster. You can find more information on how to set it up here.
Security alerts for your cluster
Additionally, you can also configure Microsoft Defender for Containers to receive security alerts for suspicious activity that is identified on your cluster, including control plane activity as well as the containerized workloads themselves. The full list of alerts can be found here. The hunting hypotheses and queries presented in this blog post assume that you do not have this enabled.
Hunting and attack scenarios
Potential Attack Paths
At a high-level, there are four different attack scenarios in Kubernetes:
- Escape onto the underlying Virtual Machine Scale Set worker node that your workload is running on and execute a host-level attack.
- Move laterally within the cluster using the Kubernetes API server - slowly escalate your privileges by hunting for other K8s service account tokens. In many cases the goal here is to deploy additional cluster workloads.
- Move laterally within Azure by using Managed Service Identities and secrets available to pods and worker nodes in the cluster.
- Evade the K8s API server - if you get access to the control plane node, there are various attack paths you can take, such as deploying a shadow API server, to evade monitoring and bypass any authentication and authorization controls implemented by the K8s API server. In the case of AKS, this should not be possible by an attacker given that the control plane infrastructure is managed by Azure and designed to prevent this type of attack.
The hunting queries and hypotheses below cover some of these scenarios with a focus on how an adversary might behave once they have gained access to a pod running on your cluster.
Hunting Hypotheses and Queries
During a threat hunting operation, the goal is not to enumerate every Tactic, Technique and Procedure an adversary might do. This approach often results in you spreading yourself too thin amidst weak signals and losing sight of the key attack inflection points. Instead, the goal is to identify the key junctures an adversary needs to cross in your service to pursue their attack and monitor for those behaviours.
To support you with your AKS threat hunting, we have provided you with a series of threat hunting hypotheses and queries to show you what sort of activity you can identify through your cluster logging and give you some ideas for what to look for. When creating your own hunt hypotheses, think about what actions an adversary would need to perform to attack your workloads.
Initial Access
Hunt Hypothesis
This hypothesis allows us to look for an adversary at a key juncture of their attack. Using kubectl exec to execute commands on your container is advantageous to an attacker for a few reasons:
- The commands being run are rarely logged and are not visible in the pod definition, making it harder for defenders to observe activity.
- Enables them to access the service account tokens for that pod. By default, every pod has a service account mounted and the service account’s permissions are determined by role bindings.
This query identifies any command execution requests being made to a container using kubectl. This query is a simple stack count that looks at what containers have had commands executed by them, by which authenticated user, using what IP address and user agent.
let _startTime = ago(30d);
let _endTime = now();
AzureDiagnostics
| where TimeGenerated between(_startTime.._endTime)
| extend log_s=parse_json(log_s)
| extend verb = tostring(log_s["verb"])
| extend objectRef = log_s["objectRef"]
| extend username = tostring(log_s["user"]["username"])
| extend userAgent = tostring(log_s["userAgent"])
| extend requestURI = tostring(log_s["requestURI"])
| extend resource = tostring(objectRef["resource"])
| extend sourceIPs = log_s["sourceIPs"]
| extend container = tostring(objectRef["name"])
| where verb == "create"
| where resource == "pods"
| where requestURI contains "/exec"
| mv-expand sourceIp=sourceIPs
| summarize Total=count(), FirstSeen=min(TimeGenerated), LastSeen=max(TimeGenerated) by verb, pod=pod_s, container, username, userAgent, sourceIp=tostring(sourceIp)
The following query provides deeper analysis into command execution activity by calculating the normalized shift between the user and service accounts that performed container command execution during a baseline period and during the time you are threat hunting across, the active period. The query shows the command execution activity where the user or service accounts performing command execution on the container are 20% different to the baseline activity. You can tune the sensitivity of the query by increasing or decreasing the Delta variable, to show less or more results, respectively.
let baselineStart = ago(30d);
let baselineUntil = ago(2d);
let bucketSize = 1d;
let normalizeDelta = (a: long, b: long) {
    (a - b)/(a + b) * 1.0
};
AzureDiagnostics
| where TimeGenerated > baselineStart
| extend log_s=parse_json(log_s)
| extend verb = tostring(log_s["verb"])
| extend objectRef = log_s["objectRef"]
| extend username = tostring(log_s["user"]["username"])
| extend userAgent = tostring(log_s["userAgent"])
| extend resource = tostring(objectRef["resource"])
| extend sourceIPs = log_s["sourceIPs"]
| extend container = tostring(objectRef["name"])
| extend requestURI = tostring(log_s["requestURI"])
| where verb == "create"
| where resource == "pods"
| where requestURI contains "/exec"
| where username != "aksProblemDetector" and requestURI !endswith "/exec?command=ls&container=tunnel-front&stderr=true&stdout=true&timeout=20s" // This is excluded as it is common for the `ls` command to be run in the tunnel-front container by the aksProblemDetector user
| mv-expand sourceIp=sourceIPs
| project TimeGenerated, pod=pod_s, container, username, userAgent, sourceIp=tostring(sourceIp)
| extend BaselineMode = iff(TimeGenerated < baselineUntil, "Baseline", "Active")
| summarize
    Requests=count()/(bucketSize/1h),
    AuthenticatedAccounts=make_set(username)
        by bin(TimeGenerated, bucketSize), pod, container, userAgent, sourceIp, BaselineMode
| summarize
    Baseline = avgif(Requests, BaselineMode == "Baseline"),
    Active = avgif(Requests, BaselineMode == "Active"),
    BaselineAuthenticatedAccounts=make_set_if(AuthenticatedAccounts, BaselineMode == "Baseline"),
    ActiveAuthenticatedAccounts=make_set_if(AuthenticatedAccounts, BaselineMode == "Active")
        by pod, container, userAgent, sourceIp
| extend Active = iff(isnan(Active), 0.0, Active), Baseline = iff(isnan(Baseline), 0.0, Baseline)
| extend Delta = iff(Baseline == 0, 1000.0, Active / Baseline), NewAuthenticatedAccounts = set_difference(ActiveAuthenticatedAccounts, BaselineAuthenticatedAccounts)
| where Delta > 0.2
Privilege Escalation
Container Escape
By default, a container is isolated from the host system’s network and memory address space using the Linux Kernel’s cgroups and namespace features. If a pod is “privileged”, its containers are essentially running without these isolation constructs which gives the container much of the same access as processes running directly on the host.
This can give an attacker several advantages:
-
Access to secrets on the underlying worker node:
- This includes the secrets and certificates provisioned to access the cluster control plane in
/etc/kubernetesand/etc/kubernetes/pki. This includes the client certificate used by the kubelet to authenticate to the Kubernetes API server. /etc/kubernetes/azure.jsoncontains the MSI or service principal that has read access to the resources within theMC_resource group.- Access the
kubeconfigfile on the worker VM which contains the kubelet’s service account token. This service account token has permissions to request all the cluster’s secrets (depending on your RBAC configuration). /var/lib/kubelet/podscontains all the secrets that are mounted as secret volume mounts for all pods on the node. By default, these secrets are mounted by the container runtime into a tmpfs volume on the container (accessible at/run/secrets). These secrets are not written to disk but are projected into the/var/lib/kubelet/podsdirectory on the underlying host. This is needed so that the kubelet can manage the secrets (create and update) during the lifecycle of the pod.
- This includes the secrets and certificates provisioned to access the cluster control plane in
- It allows an attacker to run applications directly on the underlying host. In this way, the workload is not running as a pod within the cluster but directly on the worker node and will not be monitored by the Kubernetes API server or Kubernetes audit logs.
The following are two well-known and documented methods that can be used to access the underlying host from the container:
-
Mount the host file system and escalate privileges to get full shell on the node. An attacker can do this by deploying a pod or having RCE on a pod with one or more of the following privileged configurations:
- The pod’s
securityContextset toprivileged. - A privileged
hostPathMount. - An exposed docker socket.
- Expose the host process ID namespace by setting
hostPidto True in the pod’s security context.
- The pod’s
-
Exploit Linux
cgroupsto get interactive root access on the node. A pre-requisite for this attack is toexecinto the container itself, which the above hunting hypothesis should find. Read this blog post for an example of a container escape exploiting Linuxcgroups v1 notify_on_releasefeature.
Pivoting on containers with privileged configurations
Hunt Hypothesis
This query identifies containers that have been deployed to your cluster that have a privileged security context or the host process namespace is exposed.
let lookbackStart = 50d;
let lookbackEnd = now();
let timeStep = 1d;
AzureDiagnostics
// Filter to the time range you want to examine
| where TimeGenerated between(ago(lookbackStart)..lookbackEnd)
| extend log_s=parse_json(log_s)
| extend verb = tostring(log_s["verb"])
| extend objectRef = log_s["objectRef"]
| extend requestURI = tostring(log_s["requestURI"])
| extend resource = tostring(objectRef["resource"])
| where verb == "create"
| where requestURI !contains "/exec"
| where resource == "pods"
| extend requestObject = log_s["requestObject"]
| extend spec = requestObject["spec"]
| extend containers = spec["containers"][0]
| extend username = tostring(log_s["user"]["username"])
| extend userAgent = tostring(log_s["userAgent"])
| project
    TimeGenerated,
    containerName=tostring(containers["name"]),
    containerImage=tostring(containers["image"]),
    securityContext=tostring(containers["securityContext"]),
    volumeMounts=tostring(containers["volumeMounts"]),
    namespace=tostring(objectRef["namespace"]),
    username,
    userAgent,
    containers,
    requestObject,
    objectRef,
    spec
| where isnotempty(securityContext)
// Filtering for cases where the container has a privileged security context or host process namespace is exposed
| where parse_json(todynamic(securityContext)["privileged"]) == "true" or parse_json(todynamic(spec)["hostPID"]) == "true"
| summarize Count=count() by bin(TimeGenerated, timeStep), containerImage, namespace, containerName
| render timechart
Pivoting on high-risk host volume path mounts
In Kubernetes, hostPath volume mounts give a container access to the directories on the underlying host’s file system. This configuration can be useful given the ephemeral nature of container storage but can also be abused by an attacker to move beyond the scope of their container to the underlying host.
The query below identifies containers that have been deployed to your cluster that are configured in such a way that exposes the underlying worker node’s file system.
let highRiskHostVolumePaths = datatable (path: string) [
    "/",
    "/etc",
    "/sys",
    "/proc",
    "/var",
    "/var/log",
    "/var/run",
    "/var/run/docker.sock"
];
let _startLookBack = 1d;
let _endLookBack = now();
AzureDiagnostics
| where TimeGenerated between (ago(_startLookBack).._endLookBack)
| extend log_s=parse_json(log_s)
| extend verb = tostring(log_s["verb"])
| extend objectRef = log_s["objectRef"]
| extend requestURI = tostring(log_s["requestURI"])
| extend resource = tostring(objectRef["resource"])
| where verb == "create"
| where requestURI !contains "/exec"
| where resource == "pods"
| extend spec = log_s["requestObject"]["spec"]
| extend containers = spec["containers"][0]
| extend hostVolumeMounts=spec["volumes"]
| where isnotempty(hostVolumeMounts)
| mv-expand hostVolumeMount=hostVolumeMounts
| extend hostVolumeName = hostVolumeMount["name"], hostPath=hostVolumeMount["hostPath"]
| extend hostPathName=hostPath["path"], hostPathType=hostPath["type"]
| where isnotempty(hostPathName)
| where hostPathName has_any(highRiskHostVolumePaths)
| project
    TimeGenerated,
    podName=tostring(objectRef["name"]),
    containerName=tostring(containers["name"]),
    containerImage=tostring(containers["image"]),
    namespace=tostring(objectRef["namespace"]),
    hostVolumeName,
    hostPathName,
    hostPathType
Container and worker node kernel activity (Syslog)
The following queries require you to enable Linux audit logging on your AKS worker nodes, as described above. In this case, we are going to use this auditd logging to view syscall events (primarily program executions).
Hunt Hypothesis
Stack counting all program execution on worker node and containers
This query stack counts all the programs started following a syscall call to execve (59). This gives us a high-level overview of the processes running on our cluster.
let _startTime = 50d;
let _endTime = now();
Syslog
| where TimeGenerated between(ago(_startTime).._endTime)
| where Facility == "authpriv" // This should match the facility you configured in your syslog facility settings at /etc/audisp/plugins.d/syslog.conf. By default, these events will go to the user facility but in our example configuration, we have specified to send these events to authpriv (LOG_AUTHPRIV).
| where ProcessName == "audispd"
| parse SyslogMessage with * "type=" type " msg=audit(" EventID "): " info
| extend KeyValuePairs = array_concat(
    extract_all(@"([\w\d]+)=([^ ]+)", info),
    extract_all(@"([\w\d]+)=""([^""]+)""", info))
| mv-apply KeyValuePairs on
(
    extend p = pack(tostring(KeyValuePairs[0]), tostring(KeyValuePairs[1]))
    | summarize Info=make_bag(p)
)
| summarize arg_min(TimeGenerated, HostName), EventInfo=make_bag(pack(type, Info)) by EventID
| where EventInfo["SYSCALL"]["syscall"] == "59"
| summarize Total=count(), FirstSeen=min(TimeGenerated), LastSeen=max(TimeGenerated) by tostring(EventInfo["SYSCALL"]["exe"])
| order by Total asc
Securing your cluster
- There is plenty of guidance available online for securing containerized workloads. The Azure security baseline for Azure Kubernetes Service is one such resource that provides specific guidance on how to secure your AKS cluster.
- To learn more about core security concepts for protecting your Kubernetes cluster and applications running on top of it, check out this documentation.
- Check out the MITRE ATT&CK® for Containers matrix to learn about adversary TTPs against container platforms that have been observed in the wild.
- To protect you containerized workloads against emerging threats, consider leveraging Microsoft Defender for Containers and integrating with Microsoft Sentinel Threat Intelligence.


